Melbourne Notes
By MELB_NOTE
The short answer
In Bureau of Meteorology figures for Melbourne (Olympic Park), as shown on Wikipedia, the average daily maximum is coolest in July at 14.1 °C and warmest in January at 26.6 °C. Average rainfall is 597.2 mm a year, with monthly averages from 40.5 mm in February to 58.3 mm in December. These are 1991 to 2020 averages, not a forecast. Wikipedia notes that Melbourne has a reputation for “four seasons in one day”, so for the days ahead use the Bureau of Meteorology forecast.
Many people searching for Melbourne weather want to know what it is normally like and what the famous reputation means. This guide goes month by month through temperature and rain, groups the months into the four seasons, and explains what Wikipedia says about the “four seasons in one day” saying. It is a guide to long-run averages, so it does not predict any particular day. For events this season, see what is on in Melbourne this spring.
30-second summary
- Average daily maximum: 14.1 °C in July, 26.6 °C in January.
- Average daily minimum: 7.3 °C in July, 15.7 °C in February.
- Average rainfall: 597.2 mm a year, from 40.5 mm in February to 58.3 mm in December.
- In MELB NOTE’s calculation, September to November is the wettest quarter and December to February the driest, with a modest gap.
- “Four seasons in one day” is a reputation, according to Wikipedia. For the real forecast, use the Bureau of Meteorology.
Melbourne’s average daily maximum runs from 14 °C in July to 27 °C in January

The numbers in this guide come from the table “Climate data for Melbourne (Olympic Park)” in Wikipedia’s Melbourne article, which cites the Bureau of Meteorology. The averages cover 1991 to 2020. Where this guide says “average”, it means those figures.
The chart shows each month as a bar from the average daily minimum up to the average daily maximum. January, at 26.6 °C, has the warmest average maximum, and February is close behind at 26.5 °C. July is the coolest at 14.1 °C, with June at 14.6 °C and August at 15.3 °C. The coolest average minimum is 7.3 °C in July and the warmest is 15.7 °C in February.
Over the whole year, the table gives an average daily maximum of 20.3 °C and an average daily minimum of 11.3 °C. April averages 21.0 °C and 11.6 °C, while October averages 19.8 °C and 10.3 °C.
According to Wikipedia, the city’s lowest recorded temperature is -2.8 °C on 21 July 1869, and its highest is 46.4 °C on 7 February 2009. Wikipedia cites the Bureau of Meteorology for these city records, and they show how far single days can sit from the monthly averages.

Rain is spread across the year, about 597 mm in a typical year

The Olympic Park table gives about 597.2 mm of rain in a year. The monthly averages are fairly even, which is the main point of the chart. December is the highest at 58.3 mm and February the lowest at 40.5 mm, so the spread between the wettest and driest months is under 18 mm. October, at 55.4 mm, is the second-highest month in the table.
Wikipedia’s Melbourne article also says Melbourne “rarely receives widespread or continuous rainfall”.
The circles under the bars use a different measure and a different place. They show the average number of days with 0.2 mm of rain or more at Melbourne Airport, from the same Wikipedia article. Because it is another station, treat it as a separate view, not as a count for Olympic Park. The airport figures run from 7.5 days in February to 14.8 days in August, with 135.0 days across the year. The airport rain-day count peaks in August, while the Olympic Park rainfall total peaks in December.
Stations also differ in totals. Wikipedia’s Climate of Melbourne article lists 601.3 mm a year for the CBD (Regional Office) over 1991 to 2015, 597.2 mm for Olympic Park and 515.5 mm for the airport. When two sources quote different annual rainfall for Melbourne, the station and the years are usually the reason.
Spring is the wettest quarter and summer the driest in these averages

Wikipedia’s Climate of Melbourne article gives no formal season date ranges, so MELB NOTE grouped the months in threes. The figures in the chart are calculated by MELB NOTE from the Olympic Park monthly table: the temperatures are the average of the three monthly values, and the rainfall is the sum of the three months.
- December to February: average maximum 25.8 °C, average minimum 15.1 °C, rainfall 141.9 mm.
- March to May: 21.0 °C, 11.9 °C and 143.8 mm.
- June to August: 14.7 °C, 7.7 °C and 147.8 mm.
- September to November: 19.9 °C, 10.5 °C and 163.7 mm.
In these averages, September to November is the wettest of the four quarters and December to February is the driest. The gap is modest, though. Spring is 21.8 mm ahead of summer over the three months. Winter and autumn sit in the middle, close together at 147.8 mm and 143.8 mm.
Temperature differs most. Summer averages a 25.8 °C maximum and winter 14.7 °C, a difference of 11.1 °C. Spring and autumn are the in-between seasons, with average maxima of 19.9 °C and 21.0 °C. For what is happening around the city during spring, see Melbourne spring 2026: what is on.
Four seasons in one day is a reputation, so check the forecast
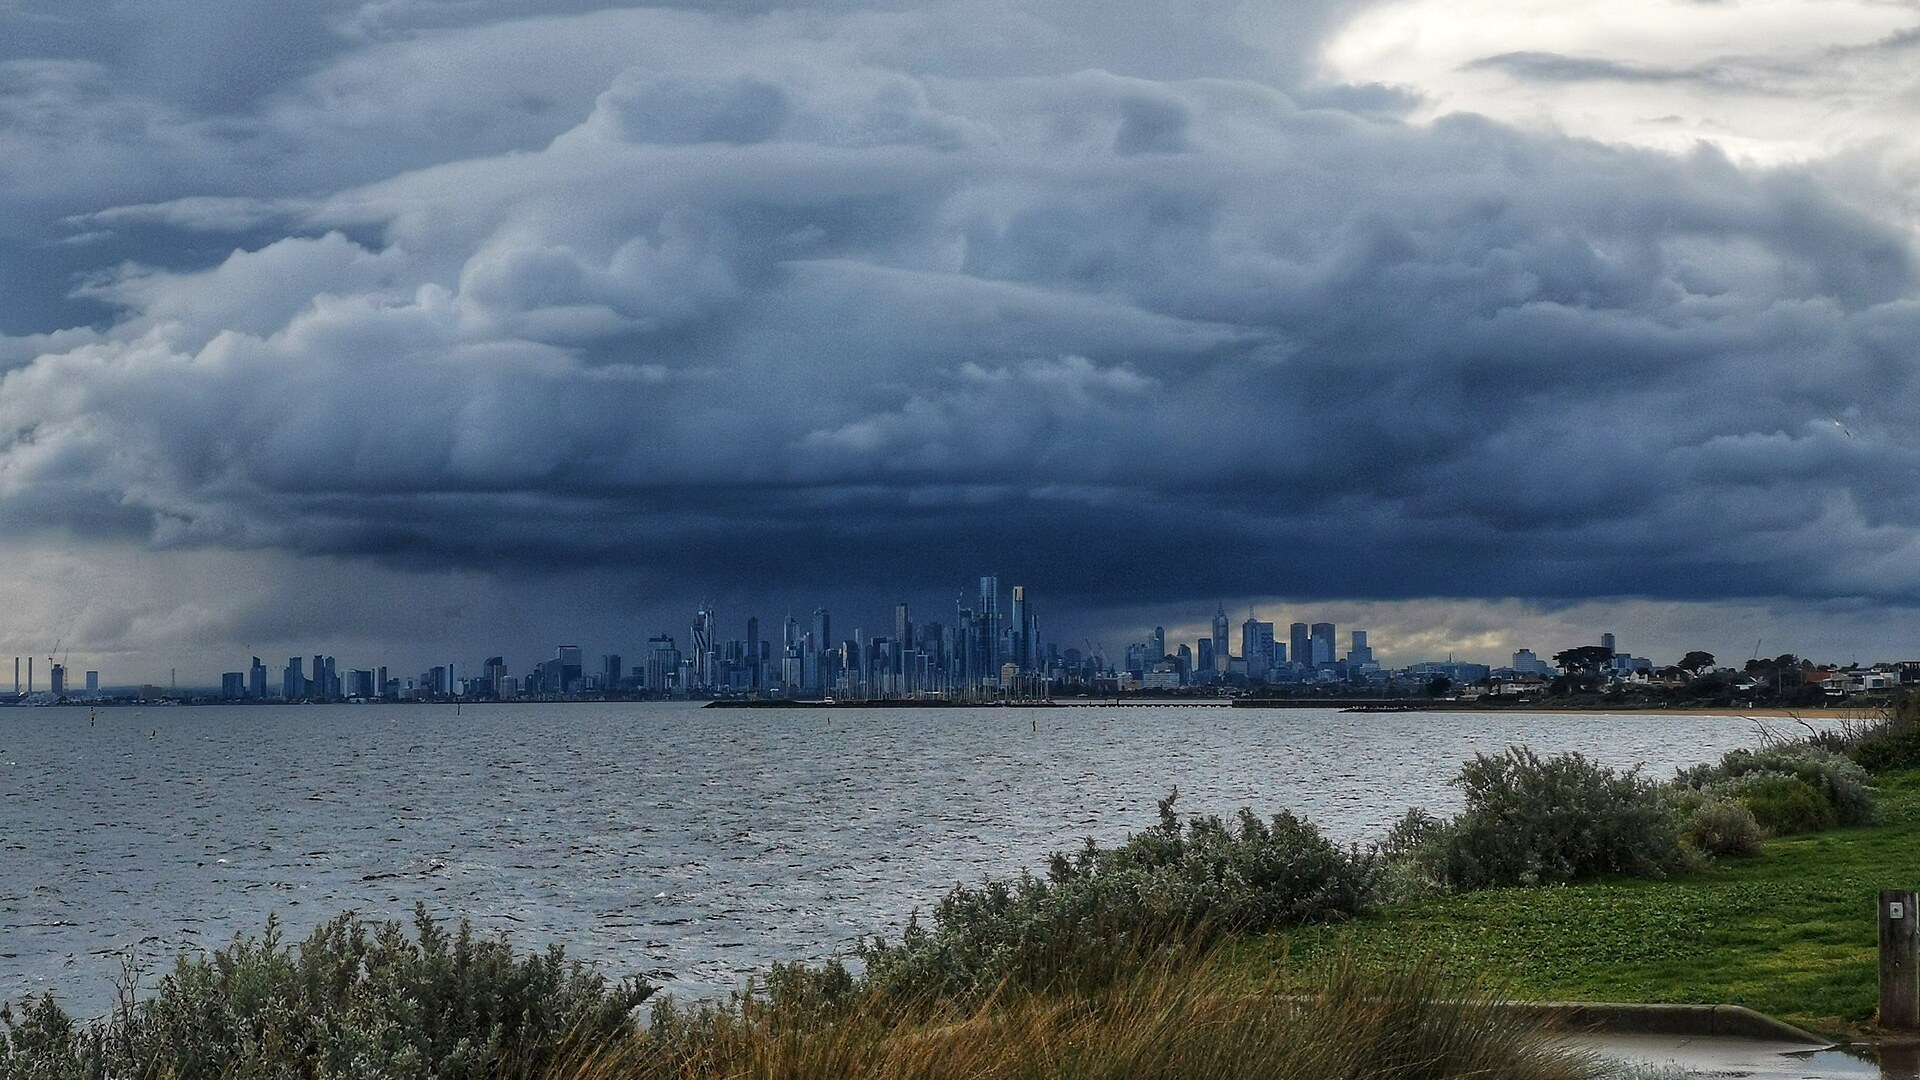
Wikipedia’s Melbourne article says the city has “a reputation for having ‘four seasons in one day’”. The Climate of Melbourne article calls the phrase “part of local popular culture”. Both describe a reputation, and neither gives a count of how often it happens, so this guide does not either.
The same article explains one weather pattern behind the idea. Melbourne is classed as Koppen Cfb, a temperate oceanic climate, with warm summers and cool, damp winters. Summer has “occasional days of extreme heat”. On some occasions, north-west winds develop ahead of a cold front, and Wikipedia says these can be “even gale force”, dragging hot inland air over south-east Australia. After the front passes, cool south-westerly winds off the Southern Ocean replace the hot air. Winter, the article says, is “cool with moderate rainfall”, and snow fell in Melbourne on 25 July 1986.
The practical point is that the averages in this guide describe the middle of the range, not the day in front of you. For current conditions, use the Bureau of Meteorology’s Melbourne forecast.

The seasons table also gives context for dates in the diary. Cup Day is on 3 November, which falls in the wettest quarter of these averages, so see the Melbourne Cup Day 2026 guide. Similarly, for a big outdoor event day, the Melbourne Marathon 2026 road closures guide covers the practical side. In both cases, the forecast closer to the day is the thing to read. For a different kind of sky-watching, see the aurora australis guide.
Questions people ask
Which months are the coldest and warmest in Melbourne?
By average daily maximum, July is the coolest at 14.1 °C and January the warmest at 26.6 °C, according to Bureau of Meteorology figures for Olympic Park shown on Wikipedia (1991 to 2020).
How much rain does Melbourne get?
The Olympic Park average is 597.2 mm a year, according to the table on Wikipedia. Wikipedia also lists 601.3 mm for the CBD (1991 to 2015) and 515.5 mm for Melbourne Airport.
Which month is the wettest?
December, at 58.3 mm in the Olympic Park averages. February is the lowest at 40.5 mm. By quarter, MELB NOTE calculates September to November as the wettest, at 163.7 mm.
Is “four seasons in one day” true?
Wikipedia describes it as a reputation and as part of local popular culture. It explains that hot north-west winds can precede a cold front and cool south-westerlies can follow it. It does not give a figure for how often this happens.
Where can I get the Melbourne forecast?
From the Bureau of Meteorology: bom.gov.au Melbourne forecast. The figures in this guide are long-run averages and not a forecast.
Sources and scope
- Wikipedia: Melbourne, including the table “Climate data for Melbourne (Olympic Park)”, which cites the Bureau of Meteorology (1991 to 2020)
- Wikipedia: Climate of Melbourne
- Bureau of Meteorology: Melbourne forecast, for current forecasts
Photo credits:
- Cover: AnnieSee, CC BY-SA 2.0, via Wikimedia Commons (cropped).
- Flinders Street Station photo: Yu Chu Chin, CC BY-SA 4.0, via Wikimedia Commons.
- Yarra River photo: Donaldytong, CC BY-SA 3.0, via Wikimedia Commons.
- Diagrams: drawn by MELB NOTE from the Wikipedia sources above.
Scope: This is a general explainer about long-run averages, not a forecast or advice on what to wear or when to visit. The monthly figures are Bureau of Meteorology data as reproduced on Wikipedia, because the Bureau climate statistics pages were unavailable when checked. The season figures are calculated by MELB NOTE from the monthly table. The rain-day counts are for Melbourne Airport, a different station. Sources checked 15 October 2026.


